-
CFPB enforcement actions spike consumer complaints, but changes aren't permanent
When consumer complaints come to the Consumer Financial Protection Bureau (CFPB) complaints database, consumers get the chance to vent their spleen about whatever happened to them. As part of these complaint records, they also name the banks that caused the problems. With this information, we can see what happens when a big bank gets a big fine.
And in September 2016, Wells Fargo got a big fine.
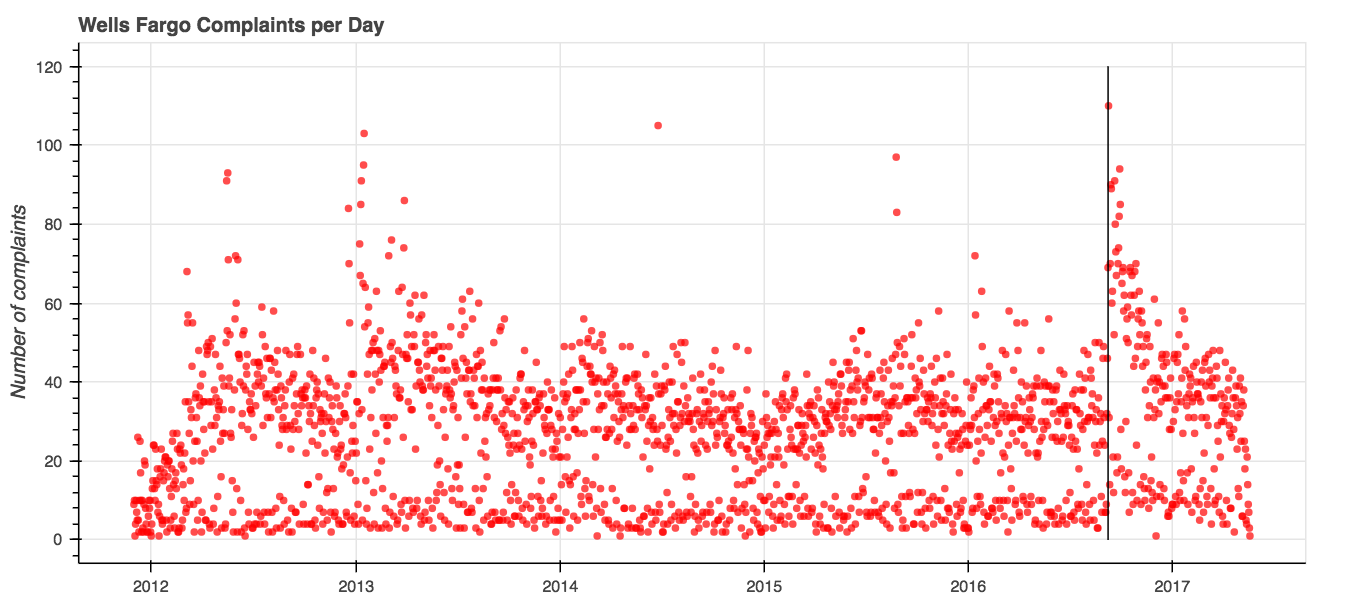
You may remember this fine. The CFPB laid down the law with a $100 million fine after consumers reported that Wells Fargo employees were opening up fake credit card accounts in their names in order to meet internal quotas. Consumers, when they heard about this became about twice as likely to complain each day.
…for a while.
In the four months prior to the fine, the CFPB registered 3,090 total complaints about Wells Fargo. In the four months after the fine was levied, complaints jumped 58 percent to 4,896 complaints. But by the end of the year, as the graph shows, the average complaint frequency dipped down to its prior levels.
Beyond the sheer numbers of complaints registered against Wells Fargo, however, there isn’t a major shift in topics of the complaints that consumers made to the CFPB.
The graph below on the left demonstrates the distribution of topics over the entire time the CFPB has been collecting those complaints. The other two graphs demonstrate the most frequent topics of complaints in the four months prior to the enforcement action being taken, and then their distribution in the four months after the enforcement action. As we covered earlier, four months was about the period of time in which the frequency of complaints had regressed to the same level as it was prior to enforcement.
Wells Fargo complaint topics
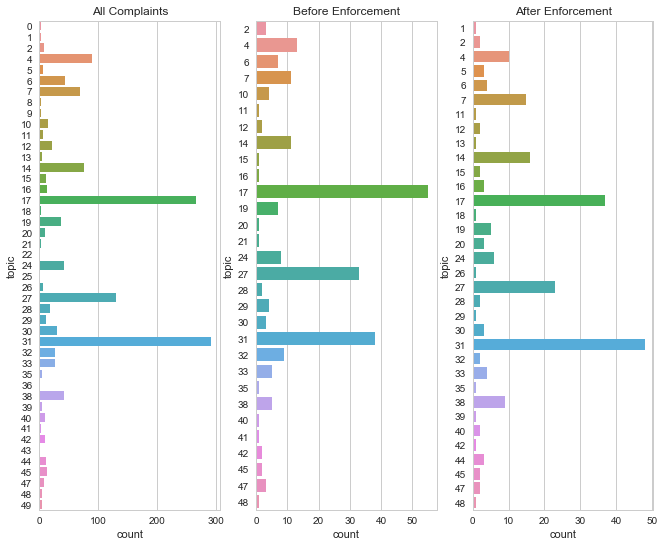
The post-enforcement topics largely mirror the pre-enforcement topics - there isn’t a large shift in conversation to entirely different topics. But three things are different:
- The topic most frequently represented changed from topic 17 to topic 31.
- There are 4 more topics after enforcement than there were prior to enforcement. New topics post-enforcement include: 5, 44, 13, 18, 26, 39, and 1. Topics that were not represented in comments after enforcement include: 10, 21, and 41.
- Topics that saw increases after enforcement tended to be those that included words about contracts and agreements, which is consistent with more complaints about the types of financial company abuses that prompted the CFPB’s enforcement action.
Selected topics from Wells Fargo complaints
Topic No. Words in topic Count prior Count after 31 acct, pmi, remove, block, thru, bayview, dob, child, I’ve, dear 37 47 17 boa, box, equip, internet, service, phh, return, install, west, cable 55 38 27 associ, recovery, new, portfolio, old, expire, type, unknown, york, service 33 23 14 party, third, agreement, term, page, consent, condition, disclose, site, exhibit 11 16 5 chase, charge, refund, discover, dispute, claim, cancel, merchant, transaction, purchase 0 3 44 contract, sign, son, signature, cancel, asset, manage, account, consult, never 0 3
In some cases, the topics covered include words similar to those that would be common with other bank or credit-card transaction issues.One significant limitation to this analysis is that only about 10% of the Wells Fargo complaints have corresponding narrative descriptions, which is where the topics arise. Just looking at the total number that included a narrative, there were 238 complaints prior to enforcement, and 218 after. This may partially explain why there was limited change in the topics discussed after the enforcement action. While many more people claimed harm, approximately as many filled in the details of their stories.
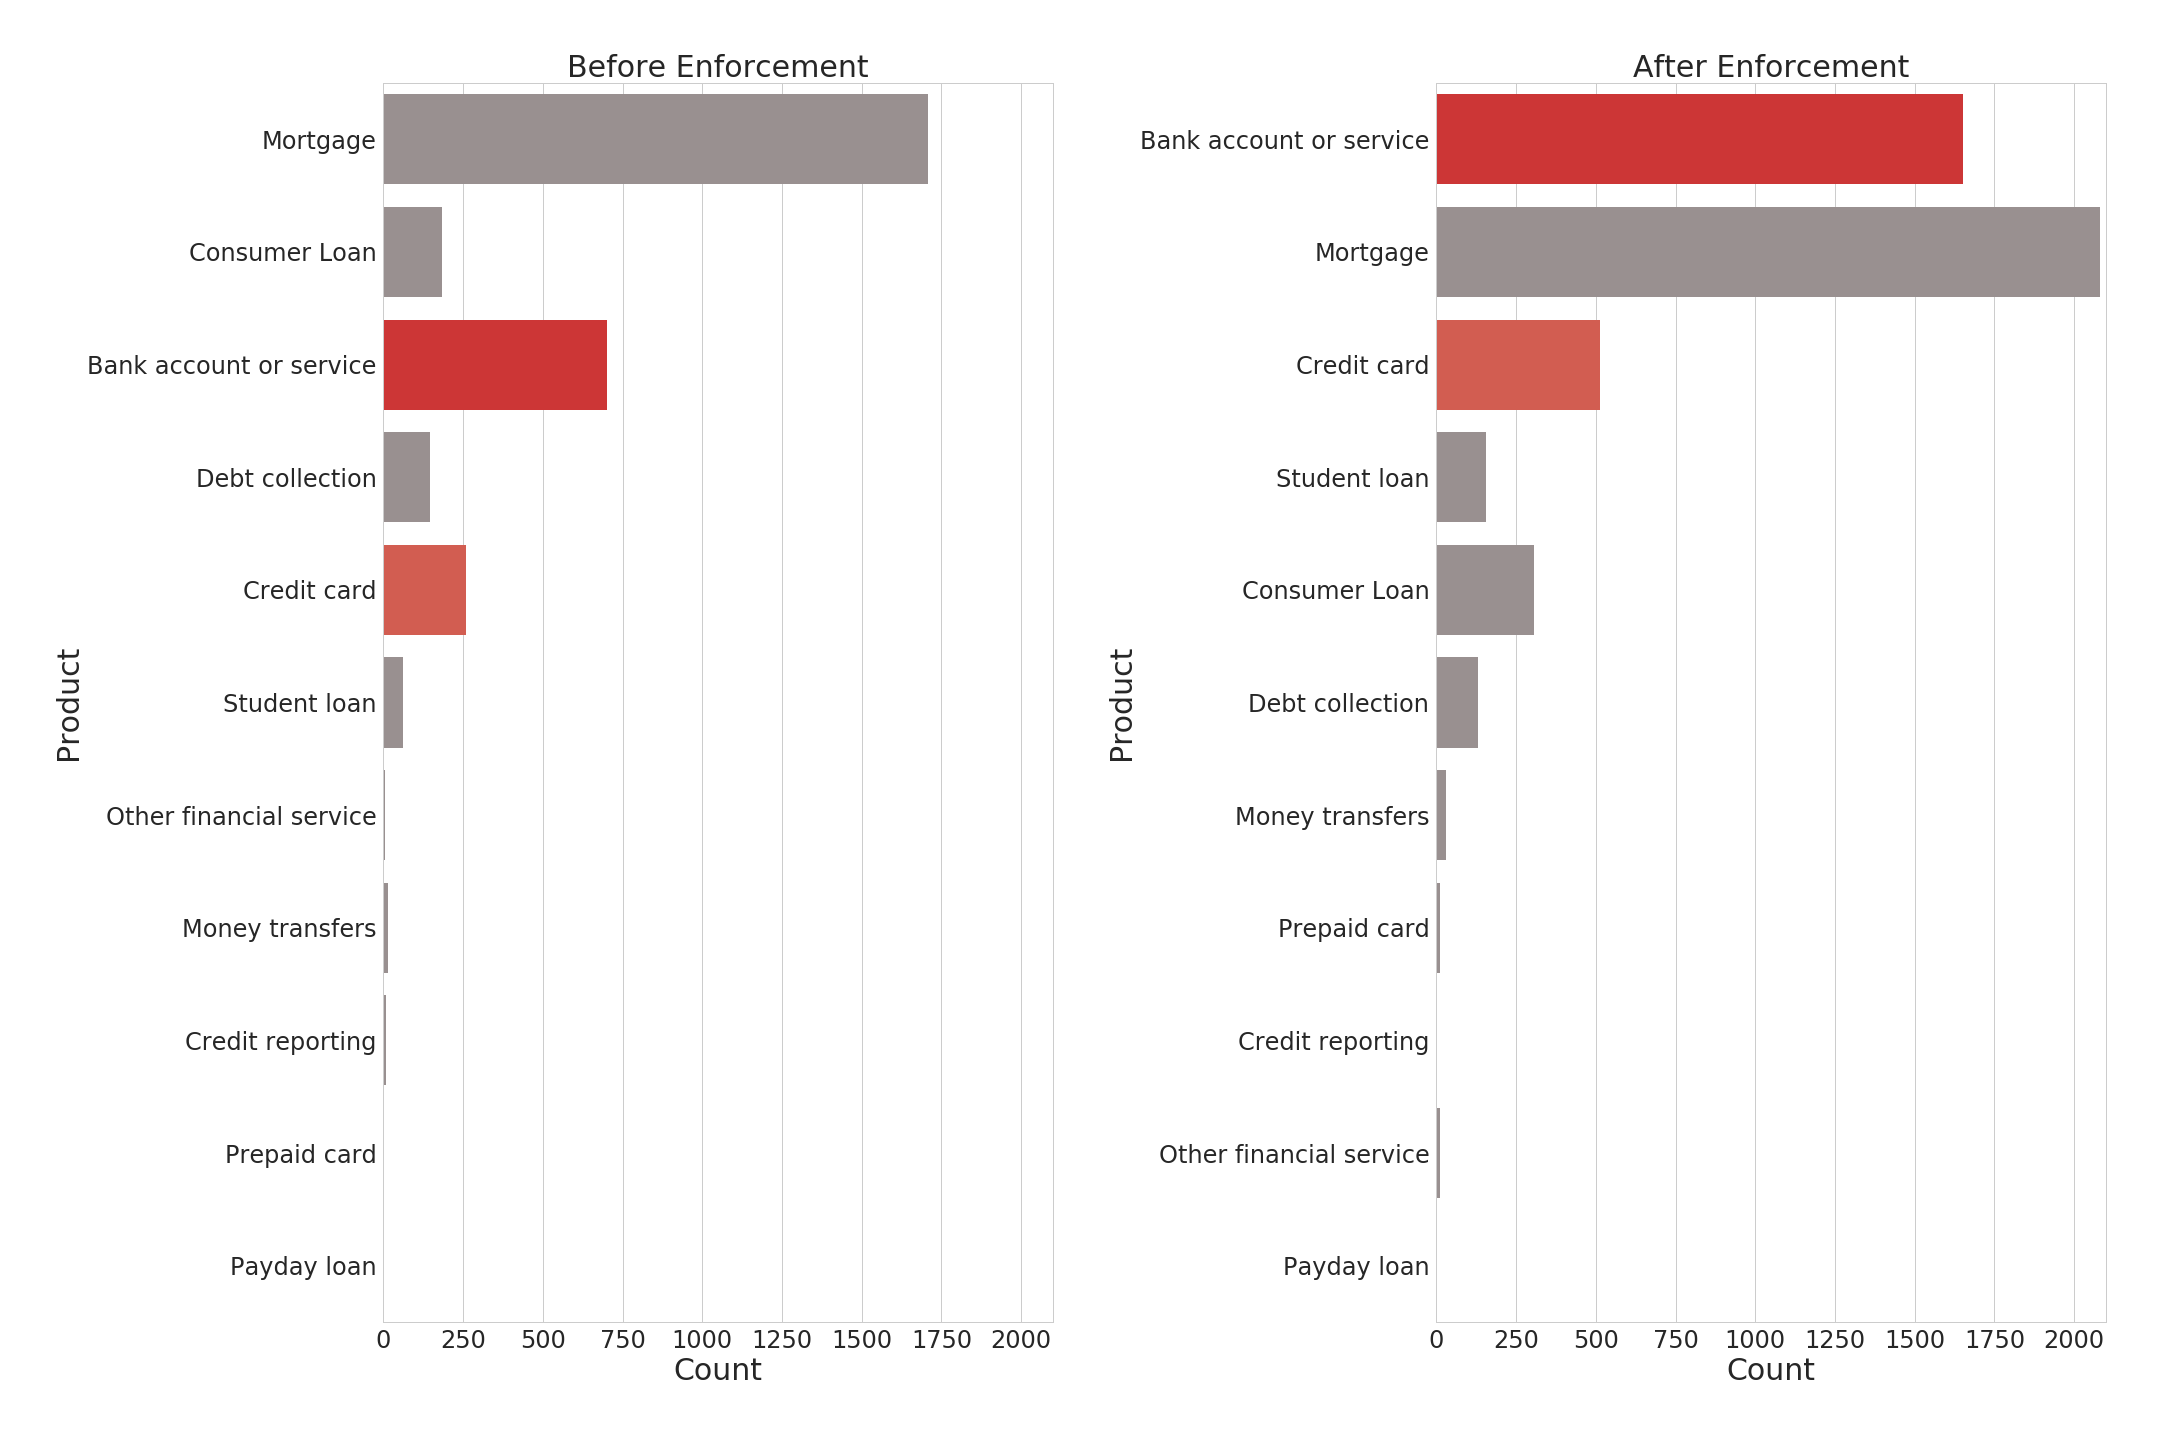
Taking a look at the way that the products that drove the complaints shows a huge shift for the “Bank account or service” product category, here in dark red, in the four months after enforcement. The lighter red indicates credit card complaints, which more than doubled over the same time period.
-
Topic modeling complaints to the CFPB
The Consumer Financial Protection Bureau (CFPB) collects consumer complaints against financial companies, as I’ve discussed in this space. In trying to meet the problems identified in these complaints, whether by the CFPB or the company itself, it’s important to understand what type of product is causing the problem. Teams work on products, and the issues across different types of financial products can vary significantly.
But the distinction between “My bank is opening up credit card applications I didn’t ask for” and “my credit card company keeps calling my house, but I haven’t missed a payment” is subtle, and the sort of thing that doesn’t lend itself to easy product classifications.
You can’t just count the number of times the term “bank” is said, or “credit card” is said and get that this is about credit cards. The first is really about the bank’s service, not the credit cards themselves. The second is really about a debt collector calling someone’s home repeatedly.
To better understand what people are talking about in these complaints, I performed a modeling technique called Latent Dirichlet Allocation.
Here’s a brief introduction to how it works.
- The words in each complaint are converted to simplified versions of the words (i.e., both “property” and “properties” become “properti”) and given unique identifier numbers.
- Numbers that appear in the same complaint documents across the entire set of complaints are grouped together into “topics”. These topics typically include words from multiple documents, and the words in a document are likely to be in multiple documents. Each word in a topic is given a weighting, indicating how “important” a word is to the topic - or how many times it is mentioned across documents in conjunction with the other words.
In the example below, the chart below demonstrates how words in documents on the left match up with the topics across the entire document, on the right.
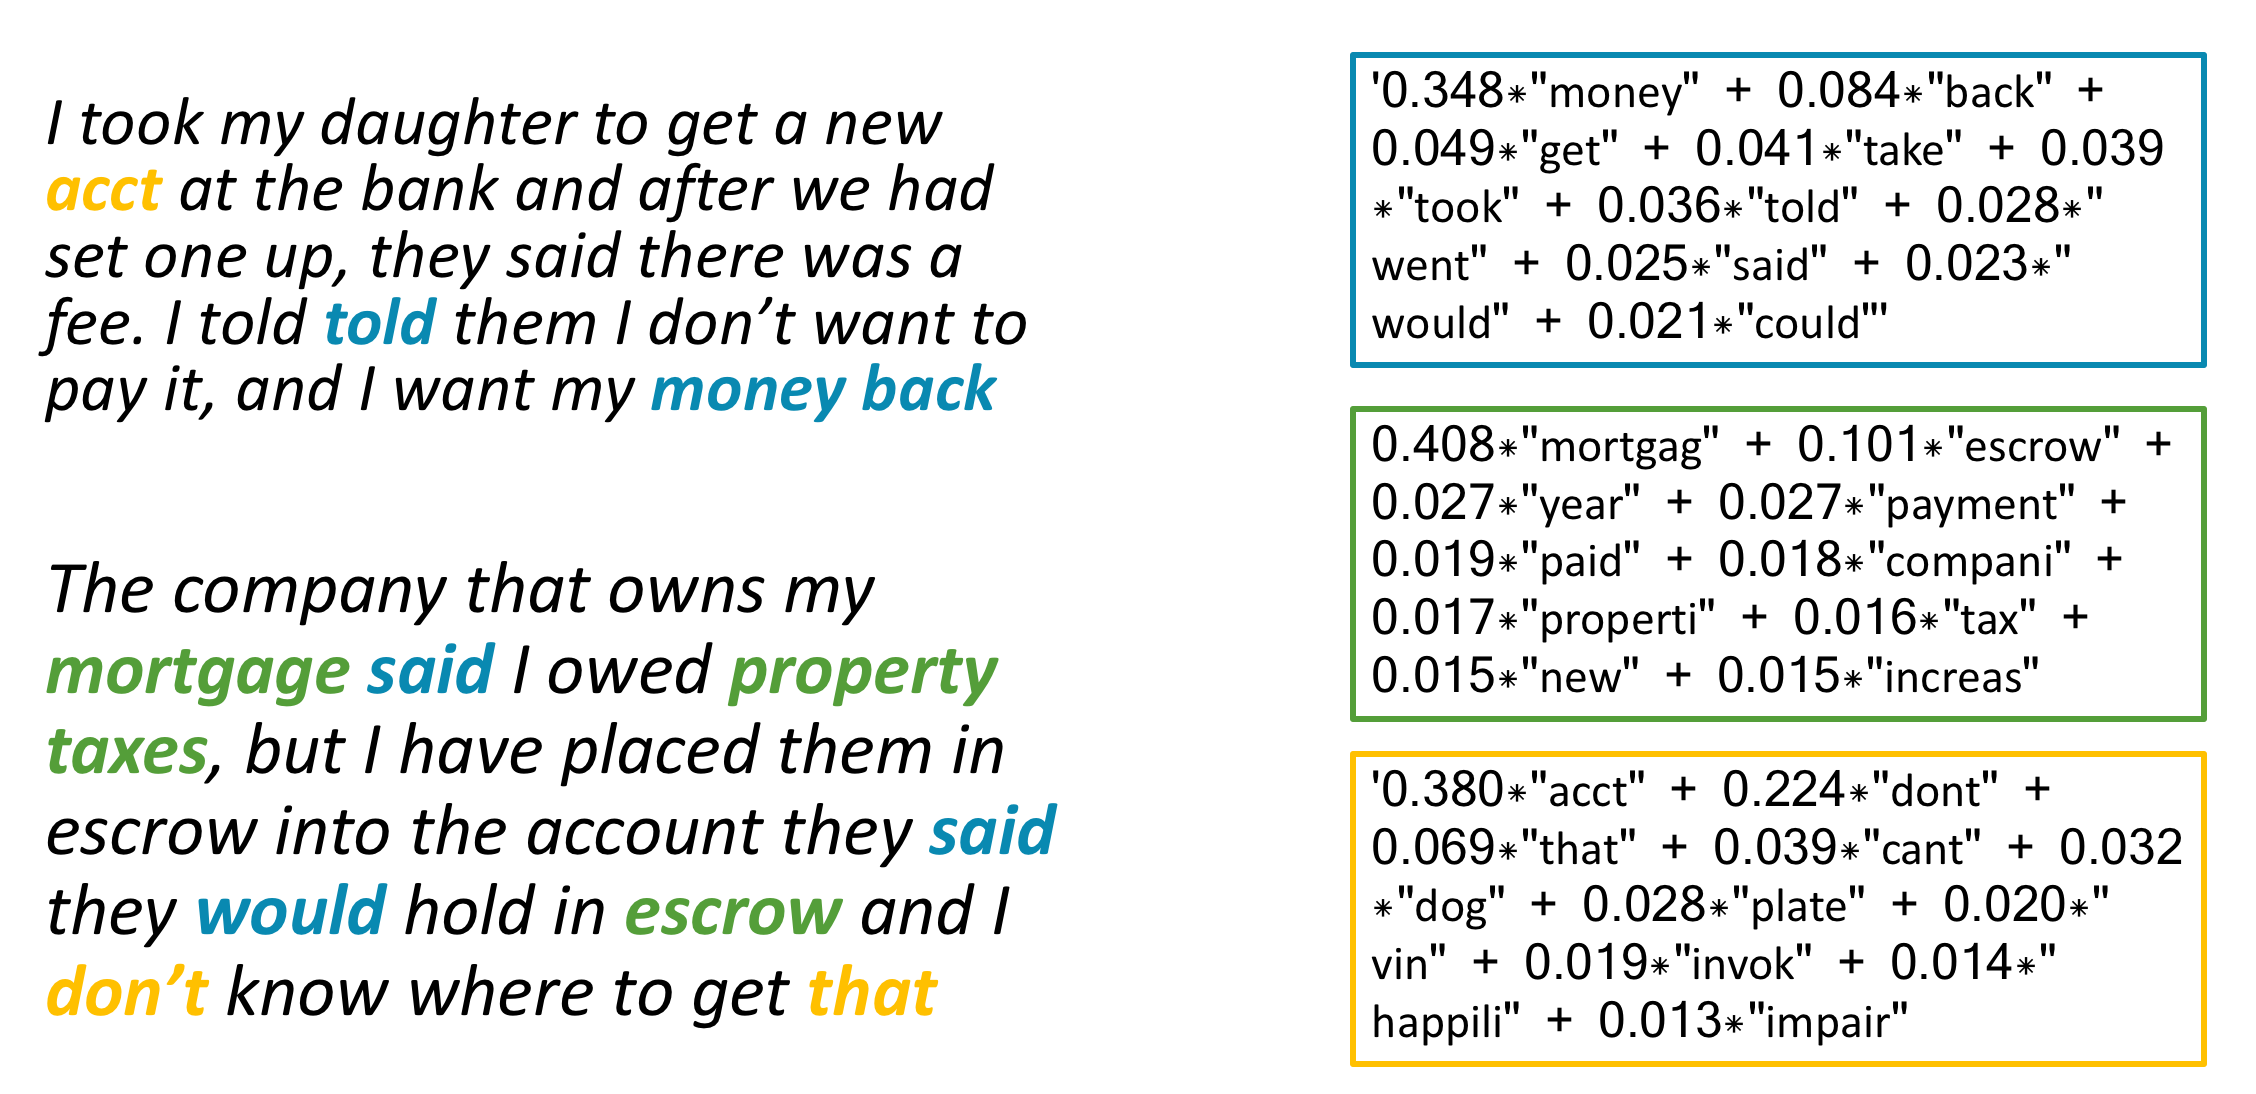
The first topic is primarily about getting money back, and how consumers interact with the customer service gatekeepers who can do that. The second is all about making mortgage or other home payments (e.g., escrow, taxes). And the third is a little more opaque, with words that describe the account, and the way that interactions go. Not all topics are readily interpretable.
I tested out a series of the topic models to see what size might be a good descriptor, and landed on a topic size of 50. The graphic below shows the relationship between topics and the words that comprise them. Bigger circles indicate topics that are more common.
More graph details
The topics are organized by plotting them on the axes of the two linear combinations that best describe their features - a method known as Principal Component Analysis. The blue bars on the right-hand side indicate the frequency of a word across all the documents in the entire dataset. The red bar indicates how frequent the terms are within a topic. The relevance metric λ is a representation of the relative exclusivity of a term - higher values are more frequent, less exclusive, and lower values are more exclusive, but may be more idiosyncratic.
The LDA visualization tool used for this project was developed by Carson Sievert and Kenny Shirley.
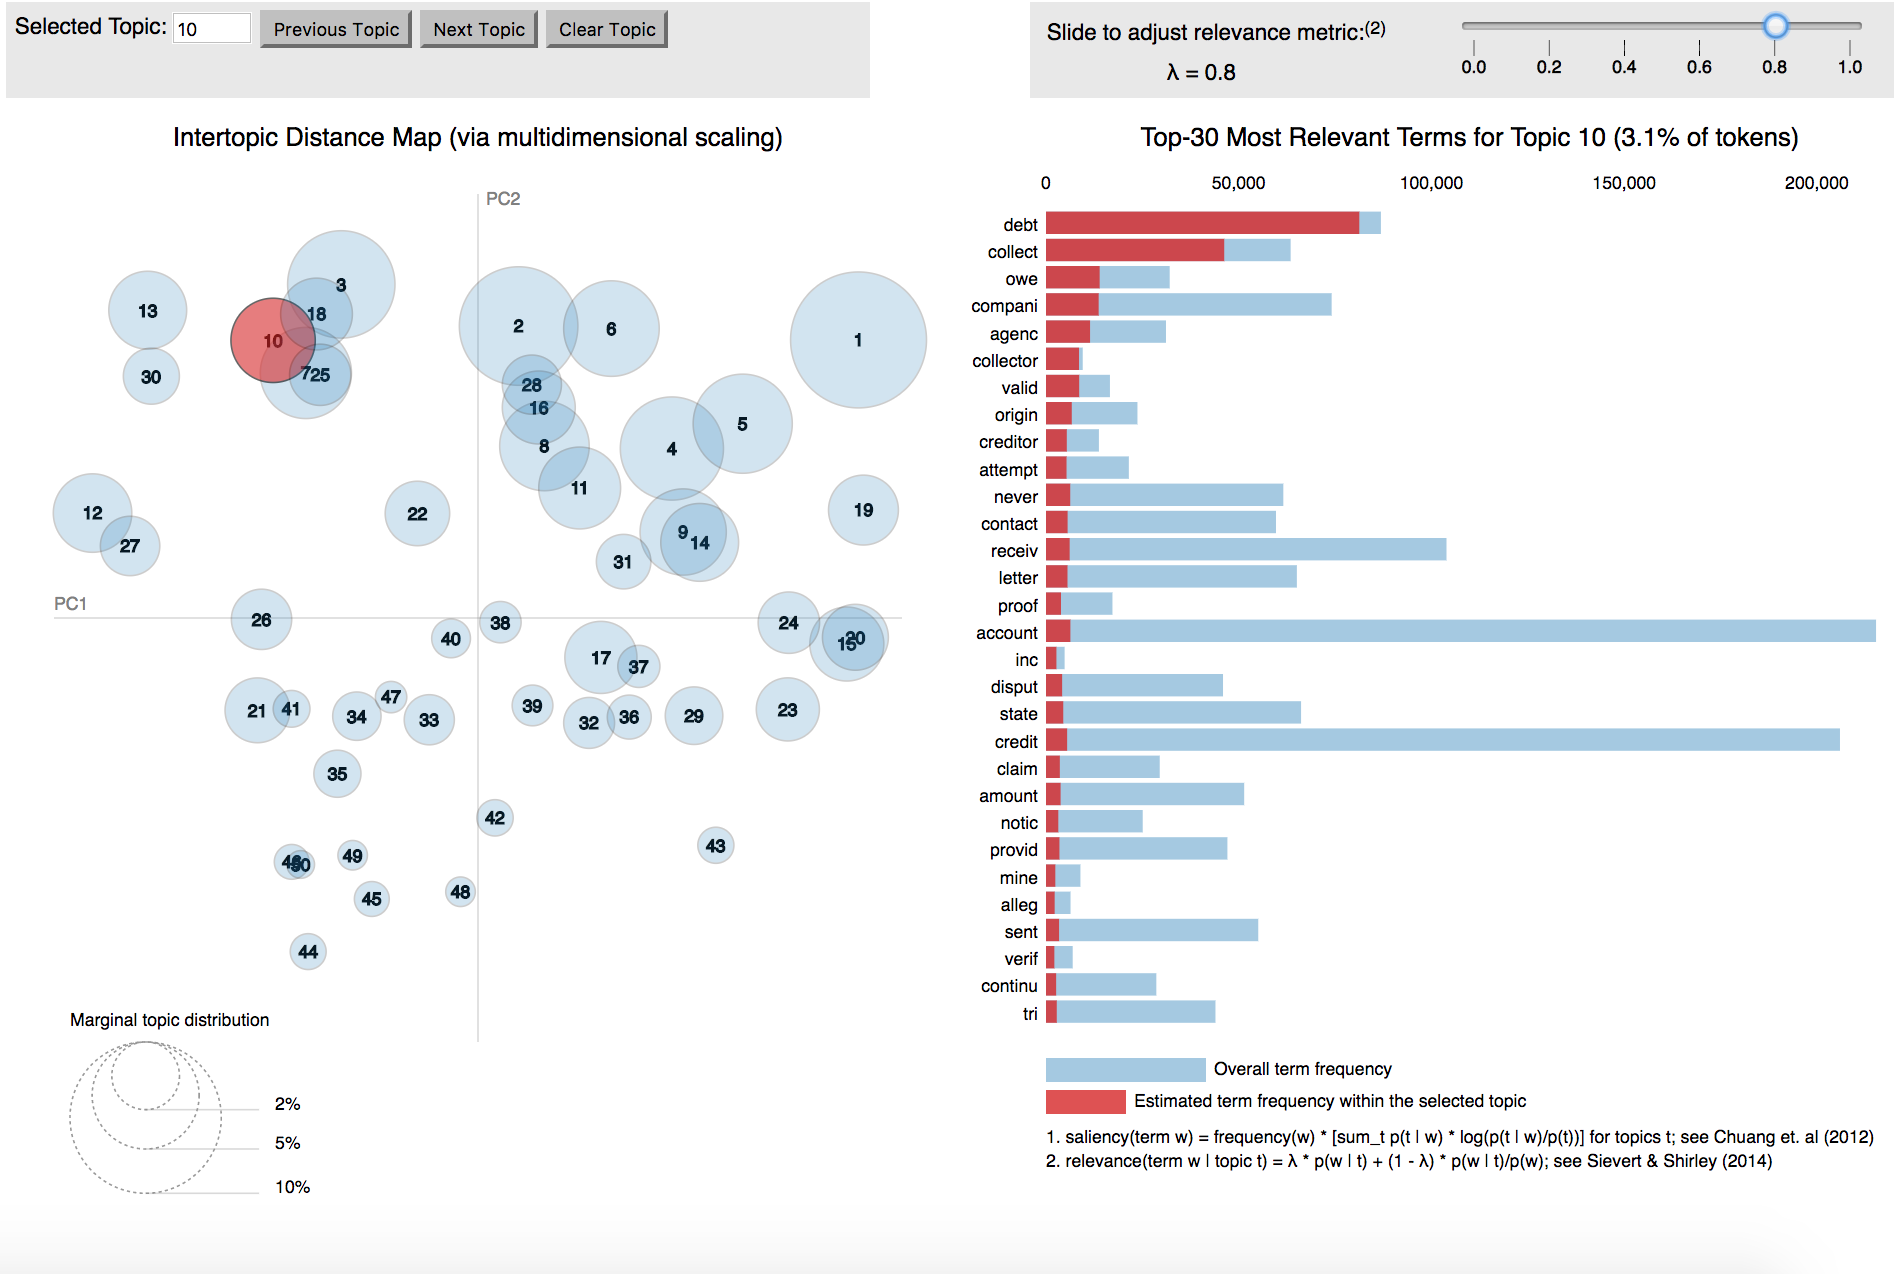
Click the image to see how all the topics are distributed
The topic highlighted here (just called #10), groups together words about debt collectors. The right-hand side walks includes the words that are common in each topic (the red bars) and the words frequencies across the entire dataset (blue bars).
This type of clustering is especially convenient for large datasets, where it’s impractical to read every one of the entries. Instead, you can look at the topics, and then check the distribution of those topics, especially where they are limited to certain groupings.
In the next iteration, I’ll be looking at the way these topics change depending on the companies and products that the complaints are about.
-
Donald Trump's inauguration prompted the most CFPB complaints ever
The Consumer Financial Protection Bureau (CFPB) has been around since 2011. The organization is charged with policing financial services companies to ensure that they are fairly treating consumers. One of the ways they gather information on consumers’ experiences is by tallying complaints of wrongdoing against companies.
And for Donald Trump’s Inauguration Day, there were more complaints to the CFPB than there have been on any other day.

While complaints have increased steadily over the CFPB’s existence, the 24 hours before Trump’s inauguration saw more than twice as many reports to the CFPB as any preceding day. There were more than 1,500 individual complaints on both Inauguration Day and the day before it.
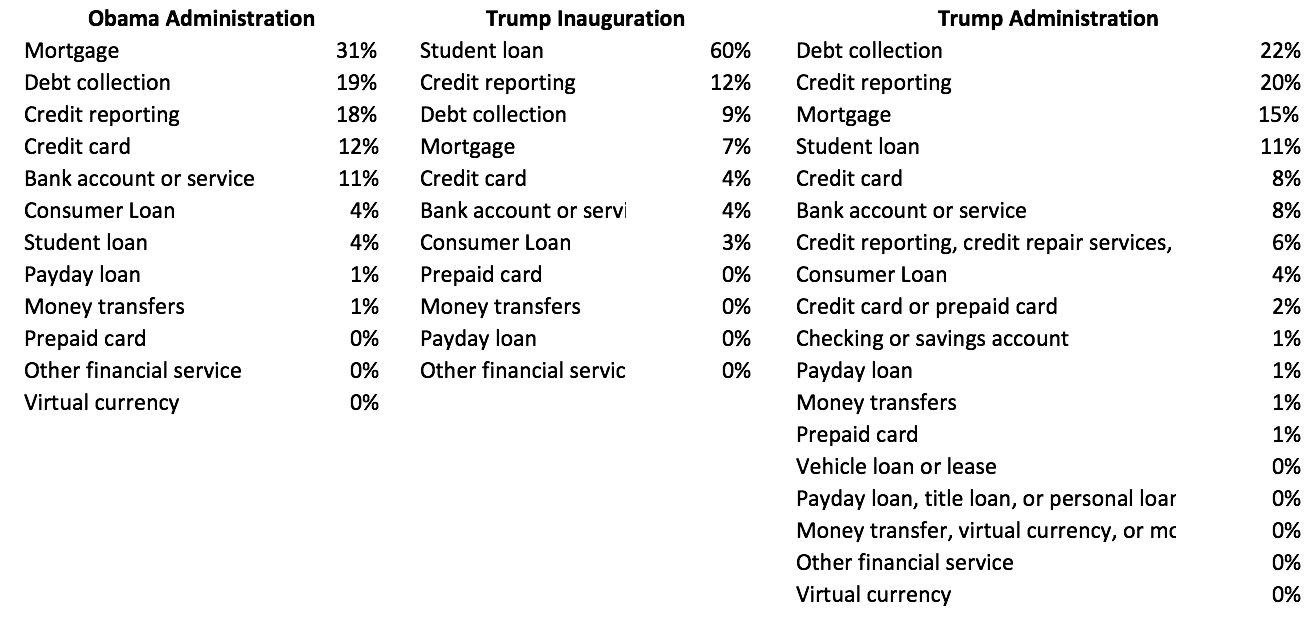
The CFPB houses a massive amount of data in its complaints database, which is open (and uses an exceptionally well-documented API, courtesy of Socrata). One particularly interesting way that this data lines up is around various types of products that people have complained about. For instance, over the course of the CFPB’s existence, mortgages and debt collection have been the two top issues that consumers have complaints about.
But on Inauguration Day, more than 60% of complaints were about student loans.
I’m especially interested in how these complaints demonstrate the ways people talk about their mistreatments, and the way those translate to actions. I’ll be pursuing those questions in the following days as part of a larger project.
-
In terms of research dollars, Johns Hopkins stands alone
Institutions of higher education are constantly comparing themselves to one another, and one of the ways they do so is using their total amount of funding dollars.
But total amount of funding is, at best, a blunt instrument. The National Center for Science and Engineering Statistics (part of the National Science Foundation) releases an annual survey of these research dollars, and breaks them down all sorts of ways, including by field.
Data
This table is a selection of the 640 universities that responded to the survey for 2015. Rank indicates the university’s relative positioning to other institutions in terms of total research funding. Johns Hopkins has the most funding, and comes in with nearly twice as much as the next-highest institution (the University of Michigan - Ann Arbor).
The other variable names correspond with research funding received by various fields in 2015 (measured in thousands of dollars).
Rank Institution Environmental sciences Life sciences Math and computer sciences Physical sciences Psychology Social sciences Sciences, nec Engineering All non-S&E fields 1 Johns Hopkins U. 31854 867715 171205 167009 3663 11034 54640 991937 6622 2 U. Michigan, Ann Arbor 14609 779922 25434 52449 21989 149805 1627 254505 68938 24 Georgia Institute of Technology 19068 19879 113353 47279 7431 9132 7645 533329 8254 28 U. Southern California 20051 411987 93765 16924 9935 27941 327 69527 40574 32 U. Illinois, Urbana-Champaign 7214 220029 114512 67182 17276 21340 5000 161458 25806 89 Carnegie Mellon U. 348 11212 109026 14162 7757 6791 3479 89054 175 Initial Exploration
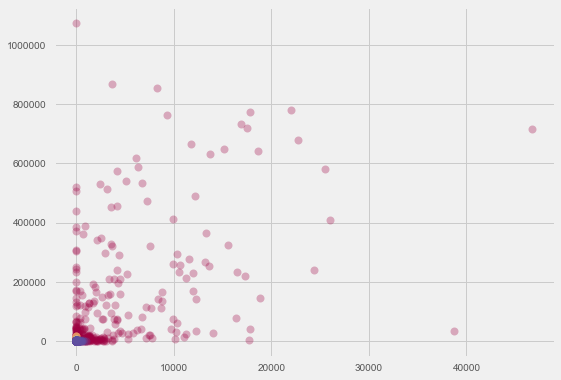
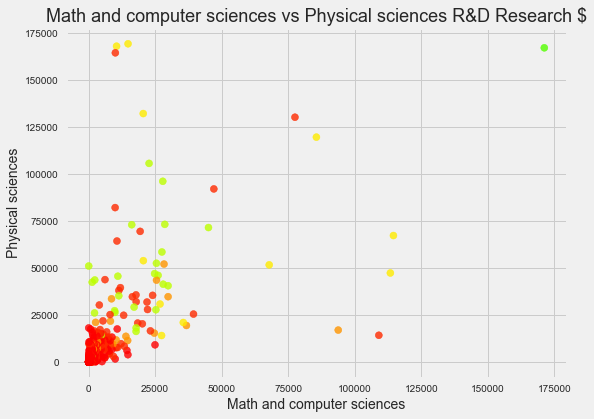
I wanted to look beyond these total figures and see how unsupervised machine learning would classify these schools compared to one another. I started by examining total research dollars for various sets of fields against one another. Scatter plots are a useful way to see that information. Here, darker points indicate greater total research dollars.
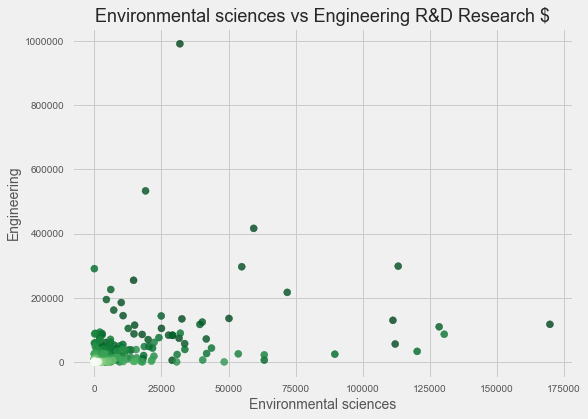
Most plots that are highly clustered around 0, with bands of institutions fanning out. In some cases, such as engineering, institutions with a greater concentration of students are outliers, but don’t necessarily show a high degree of difference between them.
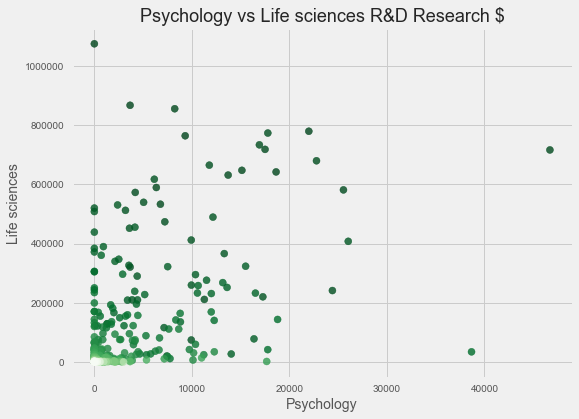
Psychology and Life Sciences, however, have a data distribution that allow us to see some of the spread of data, which makes them a decent place to start visualizing the way some of these schools might cluster together.
Density clustering
These data points seem relatively tightly grouped, and I’ll start with DBSCAN, a density-based clustering algorithm that accounts for noise as part of its algorithm. For an exceptional visualization of DBSCAN, check out Naftali Harris’s blog.
I’ll use the same plot of Psychology vs Life Sciences that looked promising before, but colorized by the clusters that DBSCAN assigns.
Yikes. This only shows 2-3 clusters, and they don’t seem to be particularly useful in describing the data. It doesn’t look particularly good, but eyeballing it isn’t always a great way to determine the usefulness of unsupervised learning algorithms, so I’ll check the numbers.
- Estimated number of clusters: 3, as we could just make out
- Homogeneity: 0.114
- Ouch - our clusters heavily overlap with one another; the best score is 1
- Completeness: 1.000
- All the members of a given class are in the same cluster - this is to be expected since we have such unbalanced classes
- V-measure: 0.205
- The harmonic mean between homogeneity and completeness, higher is better
- Silhouette Coefficient: -0.074
- This score shows how distinct clusters are from one another. Scores near zero indicate overlapping clusters (bad) and negative scores indicate incorrect clustering (worse).
So on the whole, this doesn’t seem like a very good algorithm to use. The data is too dense on the whole to create unique cluster values.
Hierarchical clustering
To improve our approach, it would be useful to be able to see how many clusters we would have at various levels. Fortunately, there is a useful approach called hierarchical clustering that builds agglomerative groupings as data points are more similar to one another.
This results in a tree-type diagram that shows the “distance” (here measured in research dollars) between two data points.
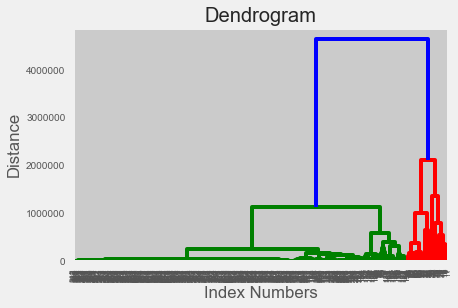
On first inspection, there look to be a couple of good places to break up our clusters.
- If we want a very simple way to break down groups, we could still break it at ~$1.5 million, which would separate into three total groups, though one would include far more data points than the other. This is basically what the DBSCAN algorithm did.
- We could do it at around $1,000,000, which would break up the green data points into two groups, and would break up the red grouping into what appears to be four clusters.
- For more granularity, a break point at $500,000 appears to create around 10 clusters, though the distinction is hard to see with this diagram.
For the purposes of grouping schools together, I think that middle class of clusters is going to create the most useful separation, so I’ll create clusters at the $1,000,000 mark.
And here is what the Psychology vs Life Sciences plot looks like, with different colors indicating cluster groupings.
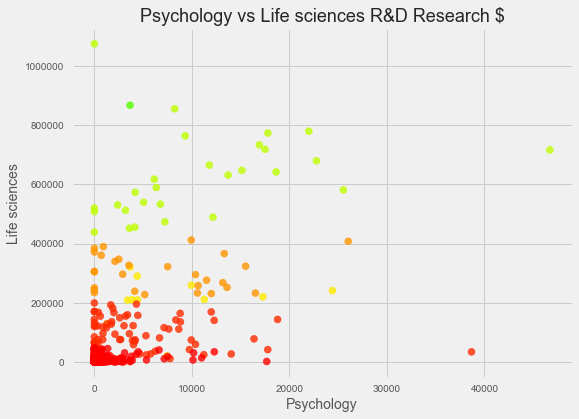
Hey! It looks like there are distinct bands of colors in there! This looks like something we can use to better understand how universities are different. Let’s look at one more.
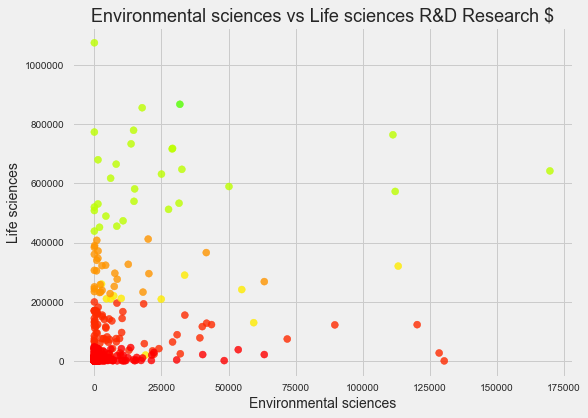
Again, a useful banding, and one that is more prominent for the Life Sciences dimension than for the Environmental Sciences one.
Not all the comparisons will look as robust, but that’s part of why the clustering itself is good - this can be difficult to eyeball.
Final cluster insights
Below I have included a table of the final cluster groups. The big takeaway is that Johns Hopkins receives so much R&D funding that it stands alone as an institution. It is a cluster unto itself. It is the übercluster.
The next cluster includes a number of state universities, many of which fund a significant portion of their operating budgets from federal grant money.
The next group of institutions includes a dozen largely technical institutions or large medical centers (as well as the University of California - Berkeley). Following that are smaller research-focused institutions, then larger institutions with less research focus, and finally a large group of primarily access-oriented institutions.
A detailed walkthrough of this analysis is available on my github, with a more reader-friendly view on NBViewer.
Here is a full list of the way these clusters break out.
Cluster Size Institutions 1 Johns Hopkins U. 28 U. California, San Diego; U. Minnesota, Twin Cities; U. Wisconsin-Madison; Ohio State U.; Stanford U.; U. California, Los Angeles; Columbia U. in the City of New York; U. Michigan, Ann Arbor; U. North Carolina, Chapel Hill; U. Washington, Seattle; Cornell U.; Duke U.; U. Texas M. D. Anderson Cancer Center; U. Pennsylvania; Harvard U.; U. California, Davis; Yale U.; U. Florida; U. Pittsburgh, Pittsburgh; Washington U., Saint Louis; Northwestern U.; Emory U.; Vanderbilt U.; U. Alabama, Birmingham; U. California, San Francisco; Baylor C. of Medicine; Icahn School of Medicine at Mt. Sinai; U. Texas Southwestern Medical Center 12 U. Illinois, Urbana-Champaign; Georgia Institute of Technology; Massachusetts Institute of Technology; Pennsylvania State U., University Park and Hershey Medical Center; North Carolina State U.; Virginia Polytechnic Institute and State U.; Purdue U., West Lafayette; Texas A&M U., College Station and Health Science Center; Michigan State U.; U. California, Berkeley; U. Arizona; SUNY, Polytechnic Institute 28 U. Southern California; U. Utah; Indiana U., Bloomington; U. Chicago; Rutgers, State U. New Jersey, New Brunswick; New York U.; U. Illinois, Chicago; SUNY, U. Buffalo; U. Georgia; Rockefeller U.; U. South Florida, Tampa; Boston U.; U. Virginia, Charlottesville; U. Rochester; U. Kentucky; U. Iowa; U. Miami; U. Cincinnati; Case Western Reserve U.; U. Colorado Denver and Anschutz Medical Campus; U. Maryland, Baltimore; Scripps Research Institute; Uniformed Services U. of the Health Sciences; Oregon Health and Science U.; Yeshiva U.; U. Massachusetts, Medical School; Medical U. South Carolina; U. Texas Health Science Center, Houston 75 Carnegie Mellon U.; U. Texas, Austin; U. Maryland, College Park; Brown U.; U. Central Florida; U. Tennessee, Knoxville; U. Hawaii, Manoa; U. Massachusetts, Amherst; Arizona State U.; Princeton U.; Iowa State U.; SUNY, Stony Brook U.; U. California, Irvine; Rice U.; Florida International U.; U. Nebraska, Lincoln; Rensselaer Polytechnic Institute; U. Notre Dame; U. California, Santa Barbara; Mississippi State U.; Florida State U.; New Jersey Institute of Technology; California Institute of Technology; U. Colorado Boulder; Oregon State U.; Clemson U.; U. Houston; George Washington U.; SUNY, U. Albany; Texas Tech U.; Colorado State U., Fort Collins; U. Delaware; Washington State U.; Drexel U.; Kansas State U.; Tufts U.; U. New Mexico; Dartmouth C.; U. California, Riverside; Louisiana State U., Baton Rouge; U. Connecticut; Temple U.; North Dakota State U.; U. Missouri, Columbia; Oklahoma State U., Stillwater; Wayne State U.; U. California, Santa Cruz; U. South Carolina, Columbia; U. Kansas; Utah State U.; U. Idaho; Georgetown U.; U. Dayton; New Mexico State U.; Tulane U.; U. Oklahoma, Norman and Health Science Center; Virginia Commonwealth U.; West Virginia U.; U. Vermont; U. Louisville; U. Mississippi; Auburn U., Auburn; Wake Forest U.; U. Arkansas, Fayetteville; Woods Hole Oceanographic Institution; Medical C. Wisconsin; U. Texas Medical Branch; U. Texas Health Science Center, San Antonio; U. Nebraska, Medical Center; U. Arkansas for Medical Sciences; Thomas Jefferson U.; Cold Spring Harbor Laboratory; Rush U.; Georgia Regents U.; U. Tennessee, Health Science Center 496 U. Alabama, Huntsville; George Mason U.; U. Alabama, Tuscaloosa; Northeastern U.; U. Louisiana, Lafayette; U. Texas, Dallas; U. Maryland, Baltimore County; Naval Postgraduate School; Air Force Institute of Technology; SUNY, Binghamton U.; U. Texas, El Paso; San Diego State U.; U. Texas, Arlington; Worcester Polytechnic Institute; U. North Texas, Denton; U. North Carolina, Charlotte; DePaul U.; Wright State U.; Syracuse U.; U. Oregon; U. Texas, San Antonio; Rochester Institute of Technology; U. Massachusetts, Lowell; U.S. Air Force Academy; Louisiana Tech U.; Michigan Technological U.; Indiana U.-Purdue U., Indianapolis; U. Tulsa; U. Memphis; Brandeis U.; Georgia State U.; Boise State U.; Illinois Institute of Technology; U. Massachusetts, Boston; North Carolina Agricultural and Technical State U.; Brigham Young U., Provo; U. Nebraska, Omaha; Toyota Technological Institute, Chicago; Kent State U.; Stevens Institute of Technology; Texas State U.; California State U., San Bernardino; Portland State U.; C. of William and Mary and Virginia Institute of Marine Science; CUNY, City C.; Missouri U. of Science and Technology; Old Dominion U.; Jackson State U.; Southern Methodist U.; U. Nevada, Reno; U. Alaska, Fairbanks; San Francisco State U.; U. Wisconsin-Milwaukee; U. New Hampshire; U. Missouri, Kansas City; U. Wyoming; U.S. Naval Academy; Texas A&M U.-Corpus Christi; U. North Carolina, general administration; U. Arkansas, Little Rock; Harvey Mudd C.; U. California, Office of the President; U. Colorado Colorado Springs; Lehigh U.; U.S. Military Academy; U. New Orleans; American U.; Delaware State U.; Montana State U., Bozeman; Baylor U.; Villanova U.; Bryn Mawr C.; U. Massachusetts, Dartmouth; Alabama A&M U.; Northern Arizona U.; CUNY, Queens C.; Florida Institute of Technology; U. South Alabama; U. Nevada, Las Vegas; Gallaudet U.; Bowie State U.; Marquette U.; U. Tennessee, Chattanooga; California Polytechnic State U., San Luis Obispo; Boston C.; Tennessee Technological U.; Tuskegee U.; Desert Research Institute; Clarkson U.; Ball State U.; Florida Atlantic U.; Creighton U.; Rutgers, State U. New Jersey, Newark; U. Maine; Howard U.; U. Puerto Rico, Mayaguez; California State U., Northridge; Dakota State U.; Elizabeth City State U.; U. California, Merced; Southern Illinois U., Carbondale; Illinois State U.; Norfolk State U.; CUNY, system office; Smith C.; Western Washington U.; U. Puerto Rico, Rio Piedras; Williams C.; South Dakota State U.; Texas Southern U.; Western Michigan U. and Homer Stryker M.D. School of Medicine; Morgan State U.; U. Montana, Missoula; U. Akron; Hampton U.; Florida A&M U.; Miami U.; California State U., Bakersfield; U. South Dakota; U. Texas, Brownsville; Sam Houston State U.; C. Charleston; CUNY, Hunter C.; U. Texas Pan American; Oakland U.; Stephen F. Austin State U.; Loyola U., Chicago; Willamette U.; Northern Illinois U.; Wellesley C.; Fordham U.; Towson U.; U. Central Arkansas; U. Minnesota, Duluth; Calvin C.; California State U., San Marcos; U. Houston-Downtown; Tennessee State U.; Pennsylvania State U., Harrisburg; Pace U.; U. Rhode Island; Columbia U., Teachers C.; California State U., Monterey Bay; U. Southern Mississippi; U. Denver; Trinity C., Hartford; Colorado School of Mines; U. Metropolitana; Idaho State U.; U. Southern Maine; U. Northern Colorado; CUNY, John Jay C. of Criminal Justice; Montclair State U.; Prairie View A&M U.; Pomona C.; Carleton C.; Duquesne U.; California State U., Fresno; Vassar C.; Xavier U. Louisiana; St. Olaf C.; Cleveland State U.; U. Arkansas, Pine Bluff; Marist C.; San Jose State U.; CUNY, Brooklyn C.; California State U., Sacramento; U. North Carolina, Wilmington; Fayetteville State U.; New School; Fairfield U.; Mount Holyoke C.; Alcorn State U.; Wesleyan U.; Lewis and Clark C.; Rutgers, State U. New Jersey, Camden; U. North Carolina, Greensboro; Arkansas State U., Jonesboro; Saint Louis U.; U. North Florida; Central Connecticut State U.; Central Michigan U.; CUNY, C. Staten Island; Trinity U.; Embry-Riddle Aeronautical U.; Southern Illinois U., Edwardsville; U. Washington, Bothell; Southern U. and A&M C., Baton Rouge; Amherst C.; California State U., Channel Islands; U. North Dakota; Lafayette C.; Purdue U., Calumet; Loyola Marymount U.; Clark Atlanta U.; Spelman C.; CUNY, Graduate Center; Kean U.; Southern Connecticut State U.; Texas A&M International U.; New Mexico Institute of Mining and Technology; James Madison U.; Virginia State U.; U. Missouri, Saint Louis; Salisbury U.; Colgate U.; Ohio U.; West Chester U. Pennsylvania; U. Houston-Clear Lake; Texas A&M U.-Commerce; Appalachian State U.; U. Washington, Tacoma; Pennsylvania State U., Behrend; Georgia Southern U.; U. Hawaii, Hilo; East Tennessee State U.; CUNY, Lehman C.; Lamar U.; Reed C.; U. Wisconsin-Stevens Point; New York Institute of Technology; Bowdoin C.; Barnard C.; Claremont Graduate U.; Macalester C.; Bowling Green State U.; Seattle U.; Oberlin C.; U. Central Oklahoma; West Virginia State U.; Kennesaw State U.; Elon U.; U. South Carolina, Aiken; Wichita State U.; Azusa Pacific U.; Bates C.; SUNY, C. of Environmental Science and Forestry; West Texas A&M U.; Benedict C.; Morehouse C.; U. Detroit Mercy; Middle Tennessee State U.; Valparaiso U.; Grinnell C.; Swarthmore C.; Winthrop U.; Grand Valley State U.; C. of Saint Benedict; California State U., Dominguez Hills; Texas Christian U.; C. Wooster; U. West Florida; Bradley U.; Rowan U.; Norwich U.; U. Hartford; La Salle U.; U. del Turabo; Siena C.; Lincoln U., Jefferson City; Saint John’s U., Collegeville; Bucknell U.; Shaw U.; Sonoma State U.; Indiana U.-Purdue U., Fort Wayne; U. Wisconsin-La Crosse; U. San Francisco; CUNY, Baruch C.; U. Wisconsin-Oshkosh; Kettering U.; California State U., Long Beach; Middlebury C.; U. South Carolina, Beaufort; Davidson C.; Minnesota State U., Mankato; Wiley C.; East Central U.; U. Baltimore; Ithaca C.; South Dakota School of Mines and Technology; Western Kentucky U.; South Carolina State U.; Lawrence Technological U.; Eastern Michigan U.; Union C., Schenectady; Saint Michael’s C.; U. Nebraska, Kearney; U. Alaska, Anchorage; Colorado C.; U. West Georgia; Florida Gulf Coast U.; St. Cloud State U.; U. Toledo; Fort Valley State U.; St. John’s U., Manhattan; Haverford C.; U. Wisconsin-Green Bay; Fisk U.; U. of the Pacific; U. Minnesota, Morris; Missouri State U.; Pepperdine U.; CUNY, Medgar Evers C.; Quinnipiac U.; Hamilton C.; East Carolina U.; Hofstra U.; U. Texas, Tyler; Furman U.; Colby C.; SUNY, Geneseo; Gonzaga U.; U. Wisconsin-Platteville; Hope C.; California State U., Chico; Claflin U.; CUNY, York C.; Suffolk U.; Kentucky State U.; California State U., Fullerton; Skidmore C.; Western Illinois U.; Murray State U.; Northern Kentucky U.; McNeese State U.; U. San Diego; Savannah State U.; Rider U.; California State Polytechnic U., Pomona; Indiana U., South Bend; U. Richmond; Eastern Connecticut State U.; U. of the District of Columbia; Marshall U.; U. Northern Iowa; Niagara U.; Nova Southeastern U.; Rhode Island School of Design; U. of Mary Washington; Chapman U.; U. Michigan, Dearborn; Roger Williams U.; Hawaii Pacific U.; Jacksonville State U.; Texas Woman’s U.; Purdue U., North Central; Central State U.; Albany C. of Pharmacy and Health Sciences; Franklin and Marshall C.; Pacific U.; Washington and Lee U.; Saginaw Valley State U.; Western Carolina U.; Dickinson C.; Saint Joseph’s U.; Coastal Carolina U.; Wheaton C., Wheaton; U. North Carolina, Asheville; Youngstown State U.; SUNY, C. Brockport; Sewanee: U. of the South; Santa Clara U.; Lake Superior State U.; U. Tennessee, Knoxville, Institute of Agriculture; U. Maryland, Center for Environmental Science; Louisiana State U., Health Sciences Center – New Orleans; U. North Texas, Health Science Center; U. Puerto Rico, Medical Sciences Campus; Eastern Virginia Medical School; Van Andel Institute; Texas Tech U., Health Sciences Center; Morehouse School of Medicine; Mercer U.; SUNY, Upstate Medical U.; SUNY, Downstate Medical Center; Loma Linda U.; Catholic U. of America; Louisiana State U., Health Sciences Center - Shreveport; Texas A&M U.-Kingsville; U. of the Virgin Islands; Texas Tech U., Health Sciences Center, El Paso; Albany Medical C.; New York Medical C.; Northeast Ohio Medical U.; Rosalind Franklin U. of Medicine and Science; Charles R. Drew U. of Medicine and Science; Meharry Medical C.; North Carolina Central U.; U. Texas Health Science Center, Tyler; Montana Tech of U. Montana; Humboldt State U.; Rhode Island C.; Tarleton State U.; U. Maryland, Eastern Shore; St. Edward’s U.; Dillard U.; Midwestern U.; Langston U.; Ponce Health Sciences U.; U. New England; U. South Florida, Saint Petersburg; Seton Hall U.; Clark U.; U. Central del Caribe; U. Guam; National Defense U.; Alfred U.; U. Massachusetts, central office; California State U., Los Angeles; Western U. of Health Sciences; Southern U. and A&M C., Agricultural Research and Extension Center; A. T. Still U.; Milwaukee School of Engineering; U. Oklahoma, Tulsa; U. of the Sciences Philadelphia; MGH Institute of Health Professions; SUNY, C. of Optometry; Roseman U. of Health Sciences; Mills C.; Touro U., Vallejo; Memorial Sloan Kettering Cancer Center, Louis V. Gerstner Jr. Graduate S. of Biomedical Sciences; Fuller Theological Seminary; Eastern Washington U.; Plymouth State U.; Tougaloo C.; Southeastern Louisiana U.; Naval War C.; Central Washington U.; Philadelphia C. of Osteopathic Medicine; Northwest Indian C.; Black Hills State U.; Erikson Institute; SUNY, Buffalo State; National U.; Alabama State U.; Edward Via C. of Osteopathic Medicine; Pittsburg State U.; Sul Ross State U.; Commonwealth Medical C.; Franklin W. Olin C. of Engineering; Austin Peay State U.; U. Illinois, Springfield; Oregon Institute of Technology; Mercyhurst U.; Connecticut C.; Grambling State U.; Morehead State U.; U. New Haven; U. Texas, Permian Basin; Keck Graduate Institute; Wheeling Jesuit U.; Palmer C. of Chiropractic, Davenport; Eastern Kentucky U.; U. Louisiana, Monroe; Oklahoma State U., Center for Health Sciences; U. South Florida, Sarasota-Manatee; Nicholls State U.; U. Alaska, Southeast; Occidental C.; California Maritime Academy; Indiana State U.; U. Puerto Rico, Cayey; Maine Maritime Academy; Marshall B. Ketchum U.; Stockton U.; U. Tampa; Bastyr U.; Albany State U.; American Samoa Community C.; Providence C.; Emerson C.; Salus U.; Alaska Pacific U.; Christopher Newport U.; Augsburg C.; Salish Kootenai C.; U. del Este; La Sierra U.; SUNY, C. Plattsburgh; Heidelberg U.; SUNY, Farmingdale State C.; Seattle Pacific U.; California State U., Stanislaus; New England C. of Optometry; U. Western States; U. Houston system administration; Keene State C.; Hobart and William Smith Colleges; U. of the Incarnate Word; U. Puerto Rico, Humacao; Augustana C., Sioux Falls; Barry U.; CUNY, Advanced Science Research Center; U. Redlands; Doane C.; Florida Polytechnic U. - Estimated number of clusters: 3, as we could just make out
-
Whitehouse.gov is much less popular after 100 days of Trump
In 2017, the primary way most citizens interact with their government is through the internet. Before they go to an office in person, before they write a letter or make a call, they visit a website. As such, the traffic across those webpages present a useful window into the way people interact with their government, and into the rhythms of American life.
To understand how traffic preferences have changed during the first 100 days of Donald Trump’s presidency, I pulled data on a month’s worth of traffic among all US government websites from analytics.usa.gov. The website compiles statistics for the prior 30 days (or 5 minutes, if you’re interested in that). To compare the way activities have changed, I compared data of the prior 30 days that included Trump’s inauguration (the most readily-available data was for Jan. 29th, nine days after his inauguration) and from his 100th day in office, April 29th.
This chart demonstrates the way views of government domains were different in April from the way they were in January. It uses a “ranking” of the number of visits a domain received.
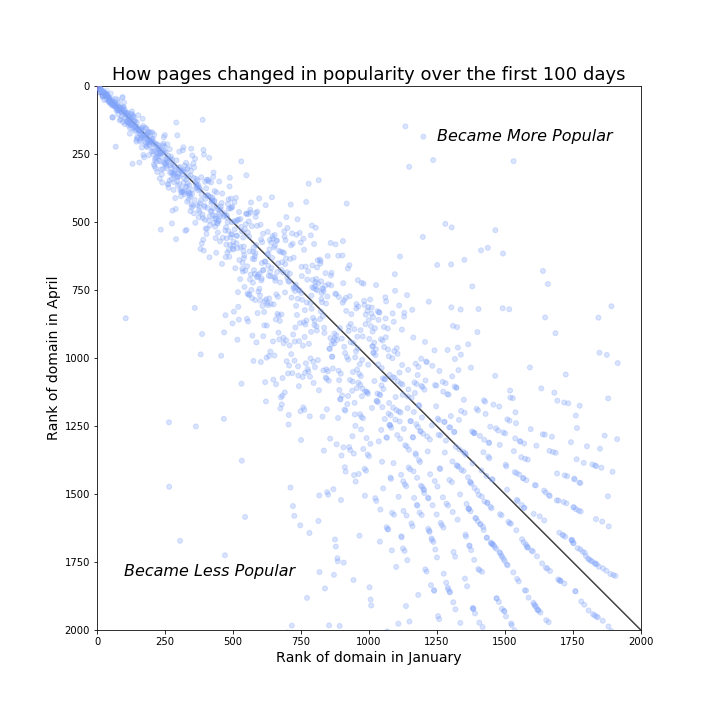
Beyond the number of visits (which determines ranking), I considered the number of pageviews a domain received over that time, as well as the number of unique users. For some pages, such as USAjobs.gov, the number of pageviews relatively high, so there is some difference in that analysis. I’ve summarized some of the bigger differences in this analysis.
Big Gainers
- IRS websites are big gainers, since the first 100 days always* coincides with Tax Day in America. The main IRS web domain saw the greatest increase in total visits among all executive branch domains
- NASA’s images domain saw the biggest growth in visitors over January, with more than 100x the visitors in the month of April as they had in January. During that time the probe Cassini crossed through the rings of Saturn and sent back stunning photos.
- The Securities and Exchange Commission includes databases that house information on publicly-traded company quarterly filings. Since the period included the end of the first fiscal quarter for many companies, it may be unsurprising that visits to the website increased 83% between the two periods.
- Visits to the White House’s anti-cyberbullying initiative jumped by 184% between January and April.
- The 100-day marker is right before many deadlines for students applying to college to receive student aid packages, which may be why pageviews of the National Postsecondary Student Aid Survey domain increased by a greater percentage than any other government domain over the period.
Big Losah’s
- The White House’s main website, whitehouse.gov plummeted in popularity between January and April. It tumbled from being the 9th most popular federal web domain to the 22nd, with 13 million fewer visitors over the 30-day period. Corresponding visits to search.whitehouse.gov fell similarly.
- Similarly, petitions to the White House fell precipitously, losing 13 rank positions and 3 million fewer visits in April than they did in January.
- The state department’s web domain that details a foreign traveler’s passport status saw a drop of more than 2 million visitors between the two months.
- The Office of Personnel Management - which DC-based folks know as the people who tell you whether the government is shut down due to snow - became much less popular in April than it was in January.
Top Government Websites
- People always want their packages and they want to know the weather, so the domains for the post office and the weather forecast are consistently some of the top website. These domains are also common API targets for mobile apps that involve weather and delivery.
- USAjobs.gov is the main federal government portal for job applicants, and is one of the top ten websites in both months.
- The Centers for Disease Control was popular in both January and April, as was the Social Security Administration.
To summarize, Americans are busy living their lives, but they are quantifiably are less interested in interacting with the public-facing part of the executive than they were at the beginning of the Trump Era.
See the full analysis of this question on Github.