Overfitting the Sweet 16
I have a very simple model for about a quarter of my NCAA bracket predictions: if UNC, move to next round.
This year, that model has worked pretty well.
But unfortunately, it only helps you out in a few circumstances. Every pick is UNC, which is useful when UNC plays Butler, but not so much when Michigan plays Oregon. So since it gives you the same output every time, no matter who is playing, statisticians and data scientists would say this model has low variance.
This is isn’t very useful for the broader world of NCAA tournament basketball, so we need a more complex model, one that describes more teams. But here’s the problem a lot of people have in building models: they use everything they know. Let me explain.
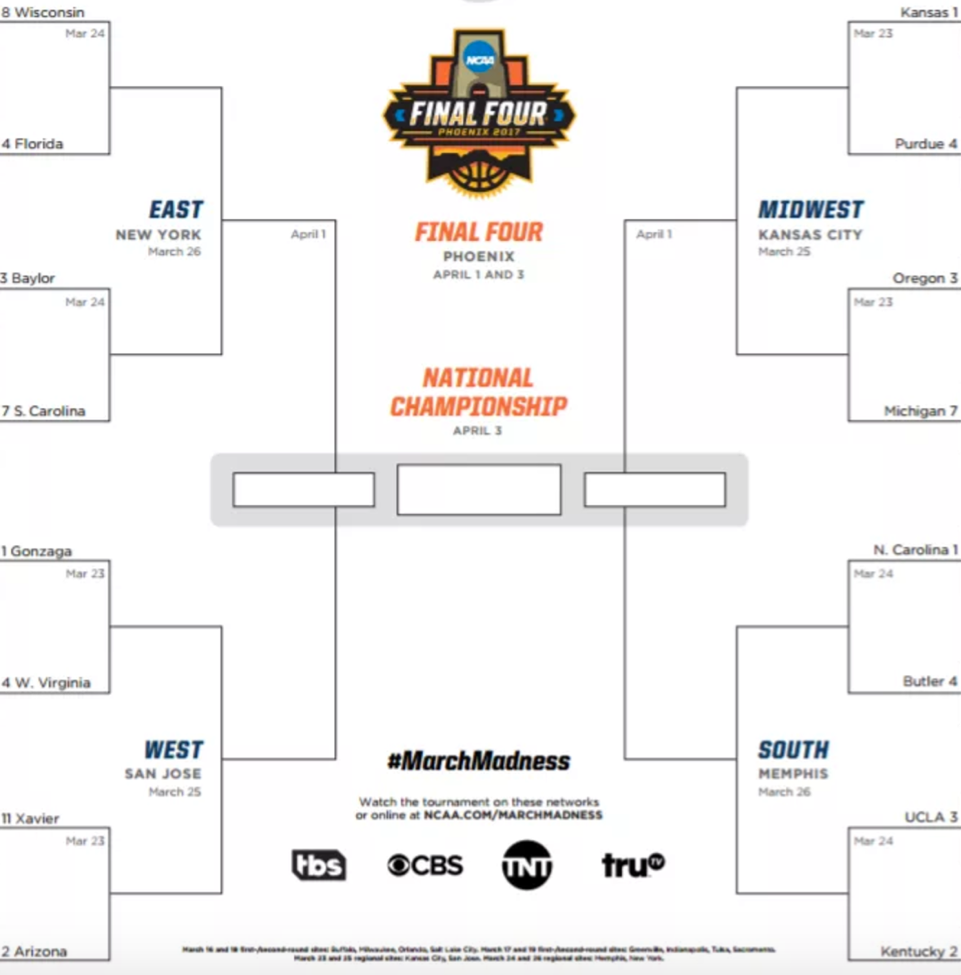
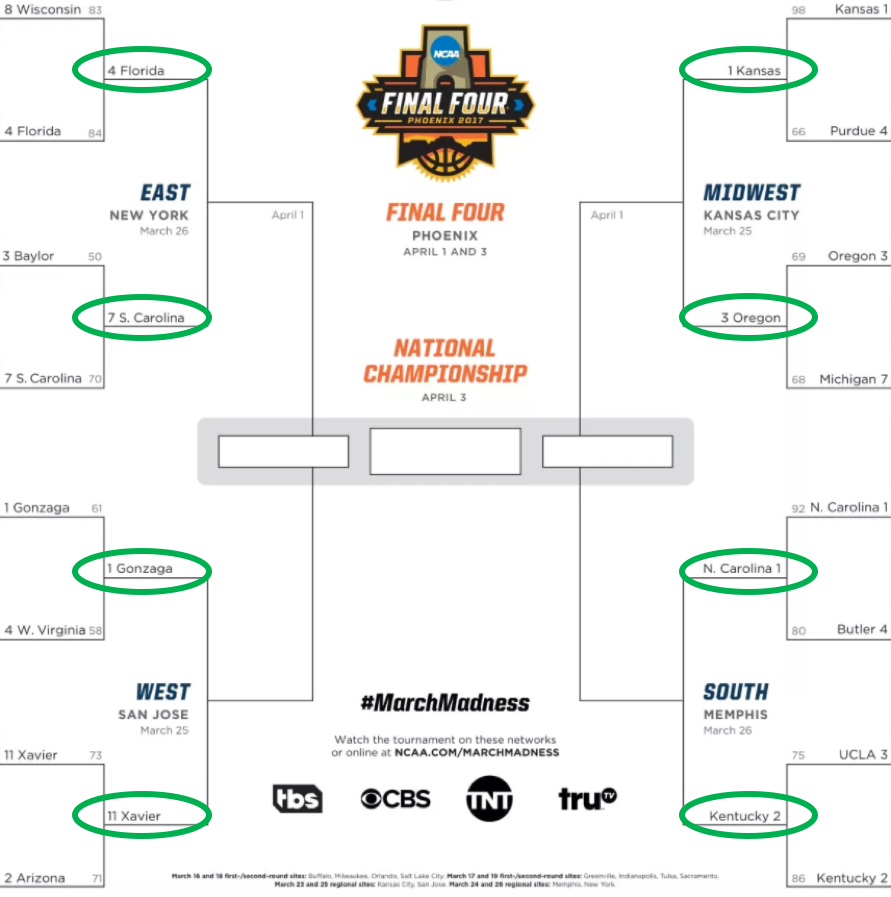
Here is the bracket of the Sweet 16 games:

Since we currently live in a world where we know who won the Sweet 16 games, we can make a super accurate model to “predict” the winners of those games. It might look like this:
- If UNC is playing, pick UNC (this is my model, after all)
- If a school has multiple NCAA championships over the last 20 years, pick it if it has more than the other school
- In a contest between schools in states near large bodies of saltwater and freshwater, pick saltwater
- If teams are both from the Confederacy, pick the eastern-most team
- If a school has an X in its name, pick it (Xs are cool)
- If all else fails, chalk (i.e., pick the team with the lower seed)
And we’ll say that these are applied in this order, so that the 1st element of the model trumps the 2nd and so on.
Here is how our picks look for the Sweet 16. It’s a weird model, but I’ve got a good feeling about it.
| Factor | Factor Description | Team Picked |
|---|---|---|
| 1. | Pick UNC | UNC |
| 2. | NCAA champions | Florida, Kentucky |
| 3. | Saltwater over freshwater | Florida, Oregon |
| 4. | Easternmost Confederate | S. Carolina |
| 5. | Has an X | Xavier |
| 6. | Chalk | Kansas, Gonzaga |
How’d we do?

Crushed it.
We got them all right! We are 100% accurate. This is the best model of all time. So we confidently deploy it to predict the winners of the Elite Eight who will move on to the Final Four.
| Factor | Factor Description | Team Picked |
|---|---|---|
| 1. | Pick UNC | UNC |
| 2. | NCAA champions | Florida |
| 3. | Saltwater over freshwater | N/A, freshwaters already eliminated |
| 4. | Easternmost Confederate | N/A, Florida already picked |
| 5. | Has an X | Xavier |
| 6. | Chalk | Kansas |
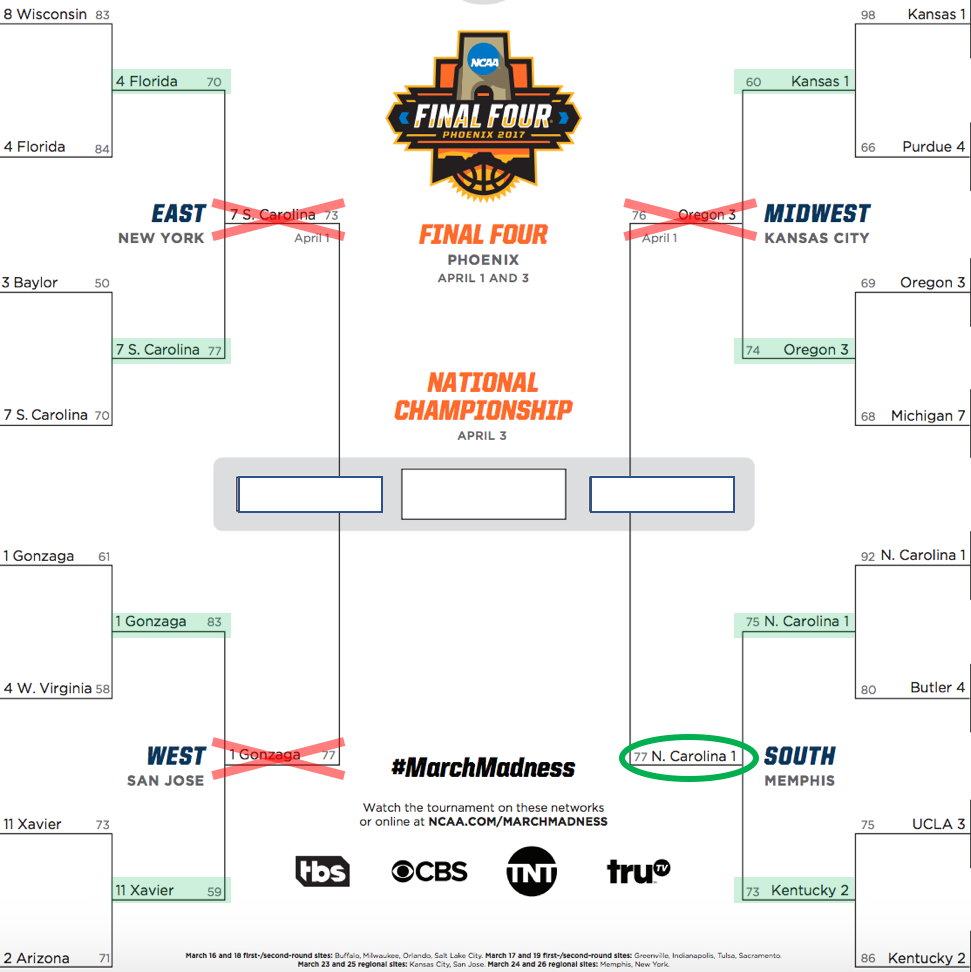
And just as we suspected…

Wait what?
The only school we got right here was UNC, giving our model an accuracy rate of 25%. Dang.
What went wrong?
When we went to create a model, we focused on hitting all the points we knew we needed to hit, which statisticians and data scientists refer to as having high bias.
This is a big problem in data science, known as “overfitting.” All that means is that predictions overly closely predict the original dataset, and aren’t flexible enough to be applied in the world.
So in summary: predictive accuracy comes at a tradeoff, called bias. Simpler models minimize this bias, but run into limitations to accuracy due to low variance. Good models are those that minimize both aspects of this.
And Go Heels.