What's the Problem -- Topic modeling consumer complaints to the CFPB
Find the full code and data for this project at GitHub here.
Overview
- This project examines the text of complaints to the Consumer Financial Protection Bureau.
- Topics are generated using Latent Dirichlet Allocation, an unsupervised clustering algorithm that groups words commonly used in the same context.
- Topics are used to predict which financial product a consumer is referring to, given a set of unstructured text. A support vector machine classifier determined which product a given complaint referred to with 77% accuracy.
- This model could be useful to a company that used a customer service chatbot to efficiently direct consumers to on-site resources.
Introduction
The Consumer Financial Protection Bureau (CFPB) has been around since 2011. The organization is charged with policing financial services companies to ensure that they are fairly treating consumers. One of the ways they gather information on consumers’ experiences is by tallying complaints of wrongdoing against companies.
This graph shows the number of complaints for every day since the organization began keeping track. Complaints have been increasing over its four-year history, and for reasons that escape me, Wednesdays and Thursdays are consistently less frequent days for complaints to be made than the rest of the week.

Complaints include information regarding the company, the product, sub-products, as well as information on whether or not the company in question responded to the consumer.
Topic Modeling
In trying to meet the problems identified in these complaints, whether by the CFPB or the company itself, it’s important to understand what type of product is causing the problem. Teams work on products, and the issues across different types of financial products can vary significantly.
But the distinction between “My bank is opening up credit card applications I didn’t ask for” and “my credit card company keeps calling my house, but I haven’t missed a payment” is subtle, and the sort of thing that doesn’t lend itself to easy product classifications.
You can’t just count the number of times the term “bank” is said, or “credit card” is said and get that this is about credit cards. The first is really about the bank’s service, not the credit cards themselves. The second is really about a debt collector calling someone’s home repeatedly.
To better understand what people are talking about in these complaints, I performed a modeling technique called Latent Dirichlet Allocation.
Here’s a brief introduction to how it works.
- The words in each complaint are converted to simplified versions of the words (i.e., both “property” and “properties” become “properti”) and given unique identifier numbers.
- Numbers that appear in the same complaint documents across the entire set of complaints are grouped together into “topics”. These topics typically include words from multiple documents, and the words in a document are likely to be in multiple documents. Each word in a topic is given a weighting, indicating how “important” a word is to the topic - or how many times it is mentioned across documents in conjunction with the other words.
In the example below, the chart below demonstrates how words in documents on the left match up with the topics across the entire document, on the right.
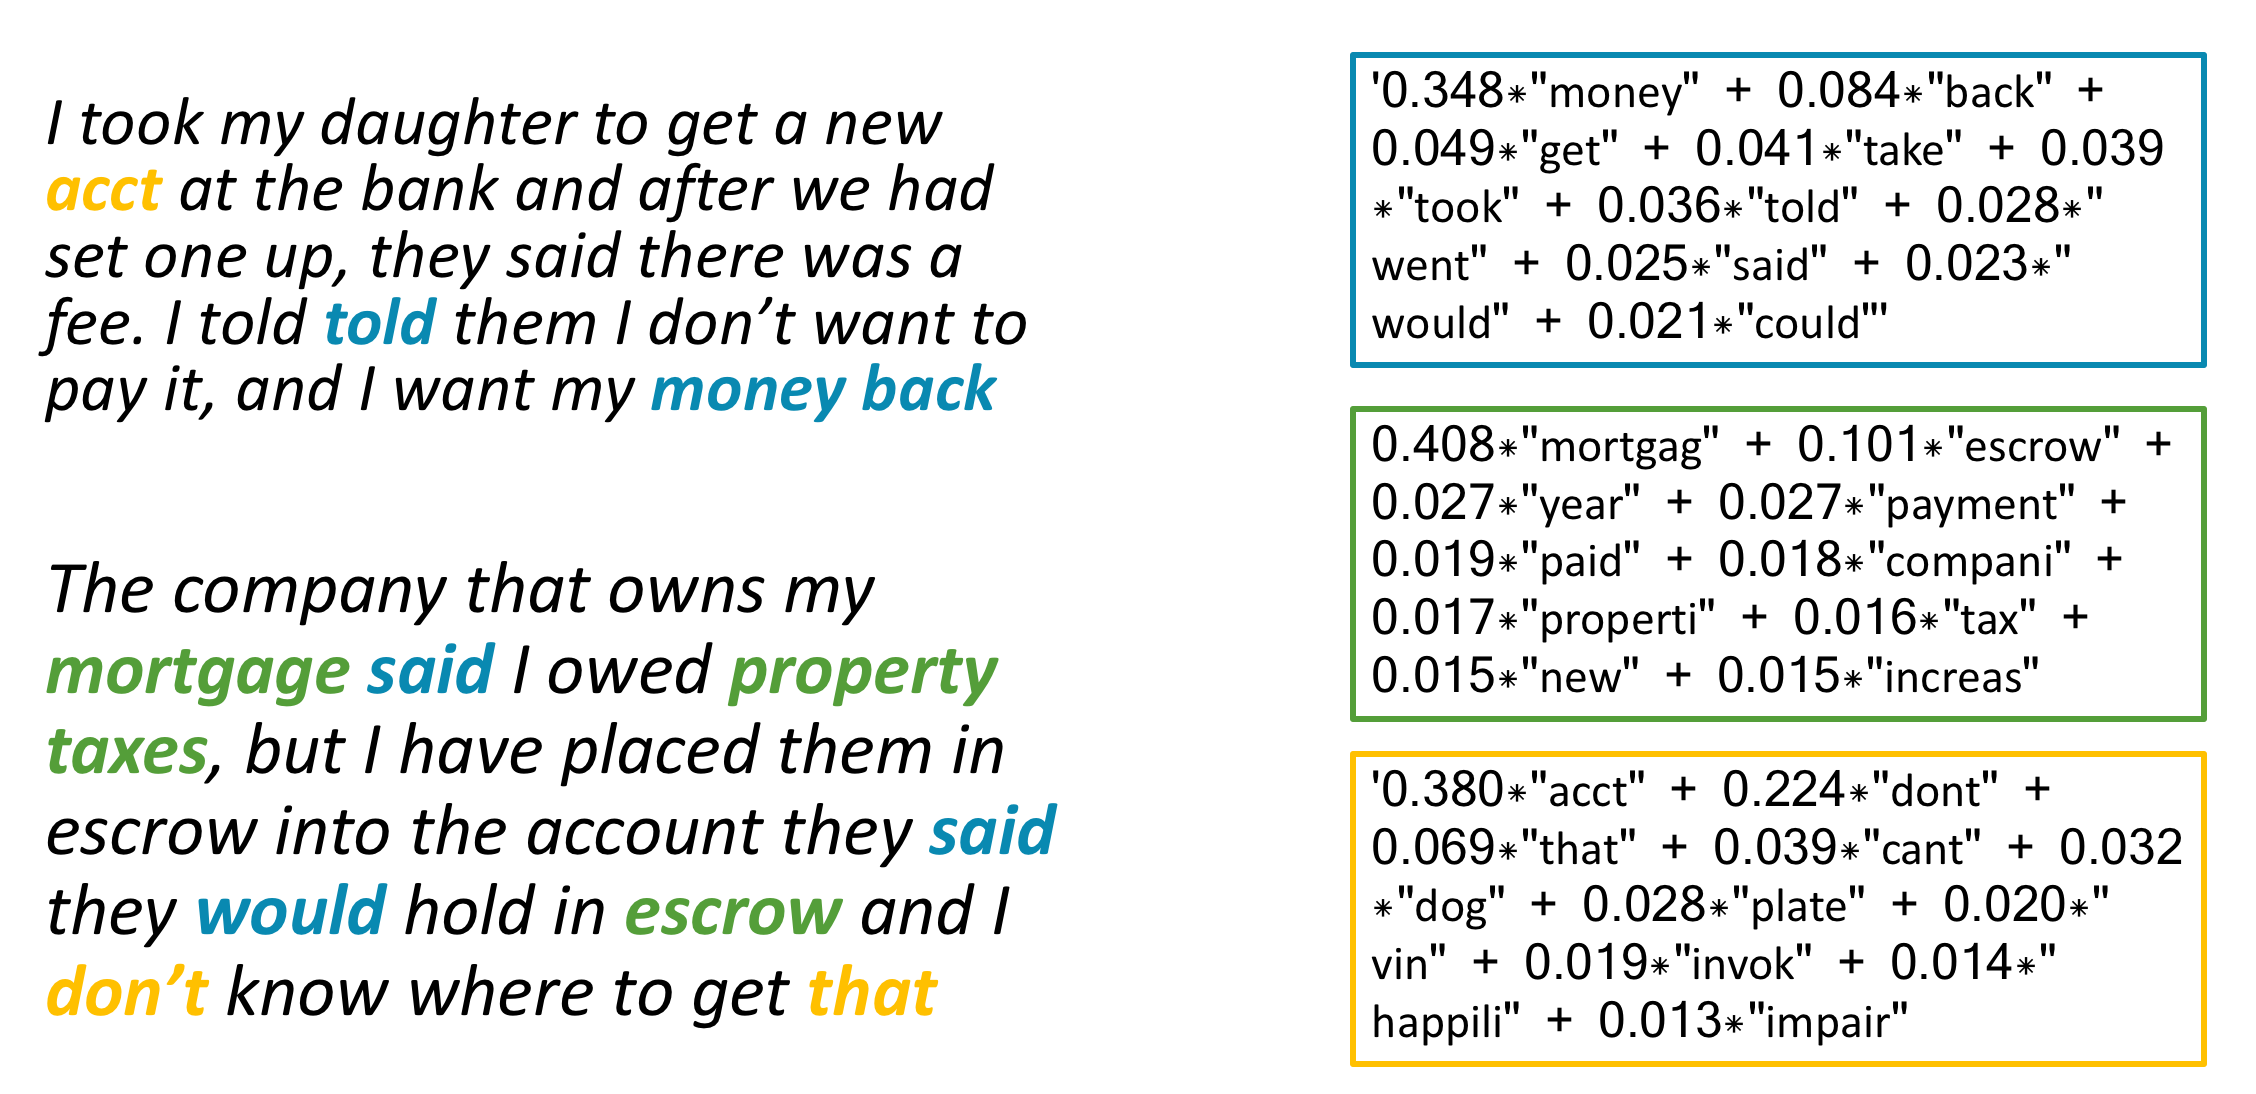
The first topic is primarily about getting money back, and how consumers interact with the customer service gatekeepers who can do that. The second is all about making mortgage or other home payments (e.g., escrow, taxes). And the third is a little more opaque, with words that describe the account, and the way that interactions go. Not all topics are readily interpretable.
I tested out a series of the topic models to see what size might be a good descriptor, and landed on a topic size of 50. The graphic below shows the relationship between topics and the words that comprise them. Bigger circles indicate topics that are more common.
More graph details
The topics are organized by plotting them on the axes of the two linear combinations that best describe their features - a method known as Principal Component Analysis. The blue bars on the right-hand side indicate the frequency of a word across all the documents in the entire dataset. The red bar indicates how frequent the terms are within a topic. The relevance metric λ is a representation of the relative exclusivity of a term - higher values are more frequent, less exclusive, and lower values are more exclusive, but may be more idiosyncratic.The LDA visualization tool used for this project was developed by Carson Sievert and Kenny Shirley.
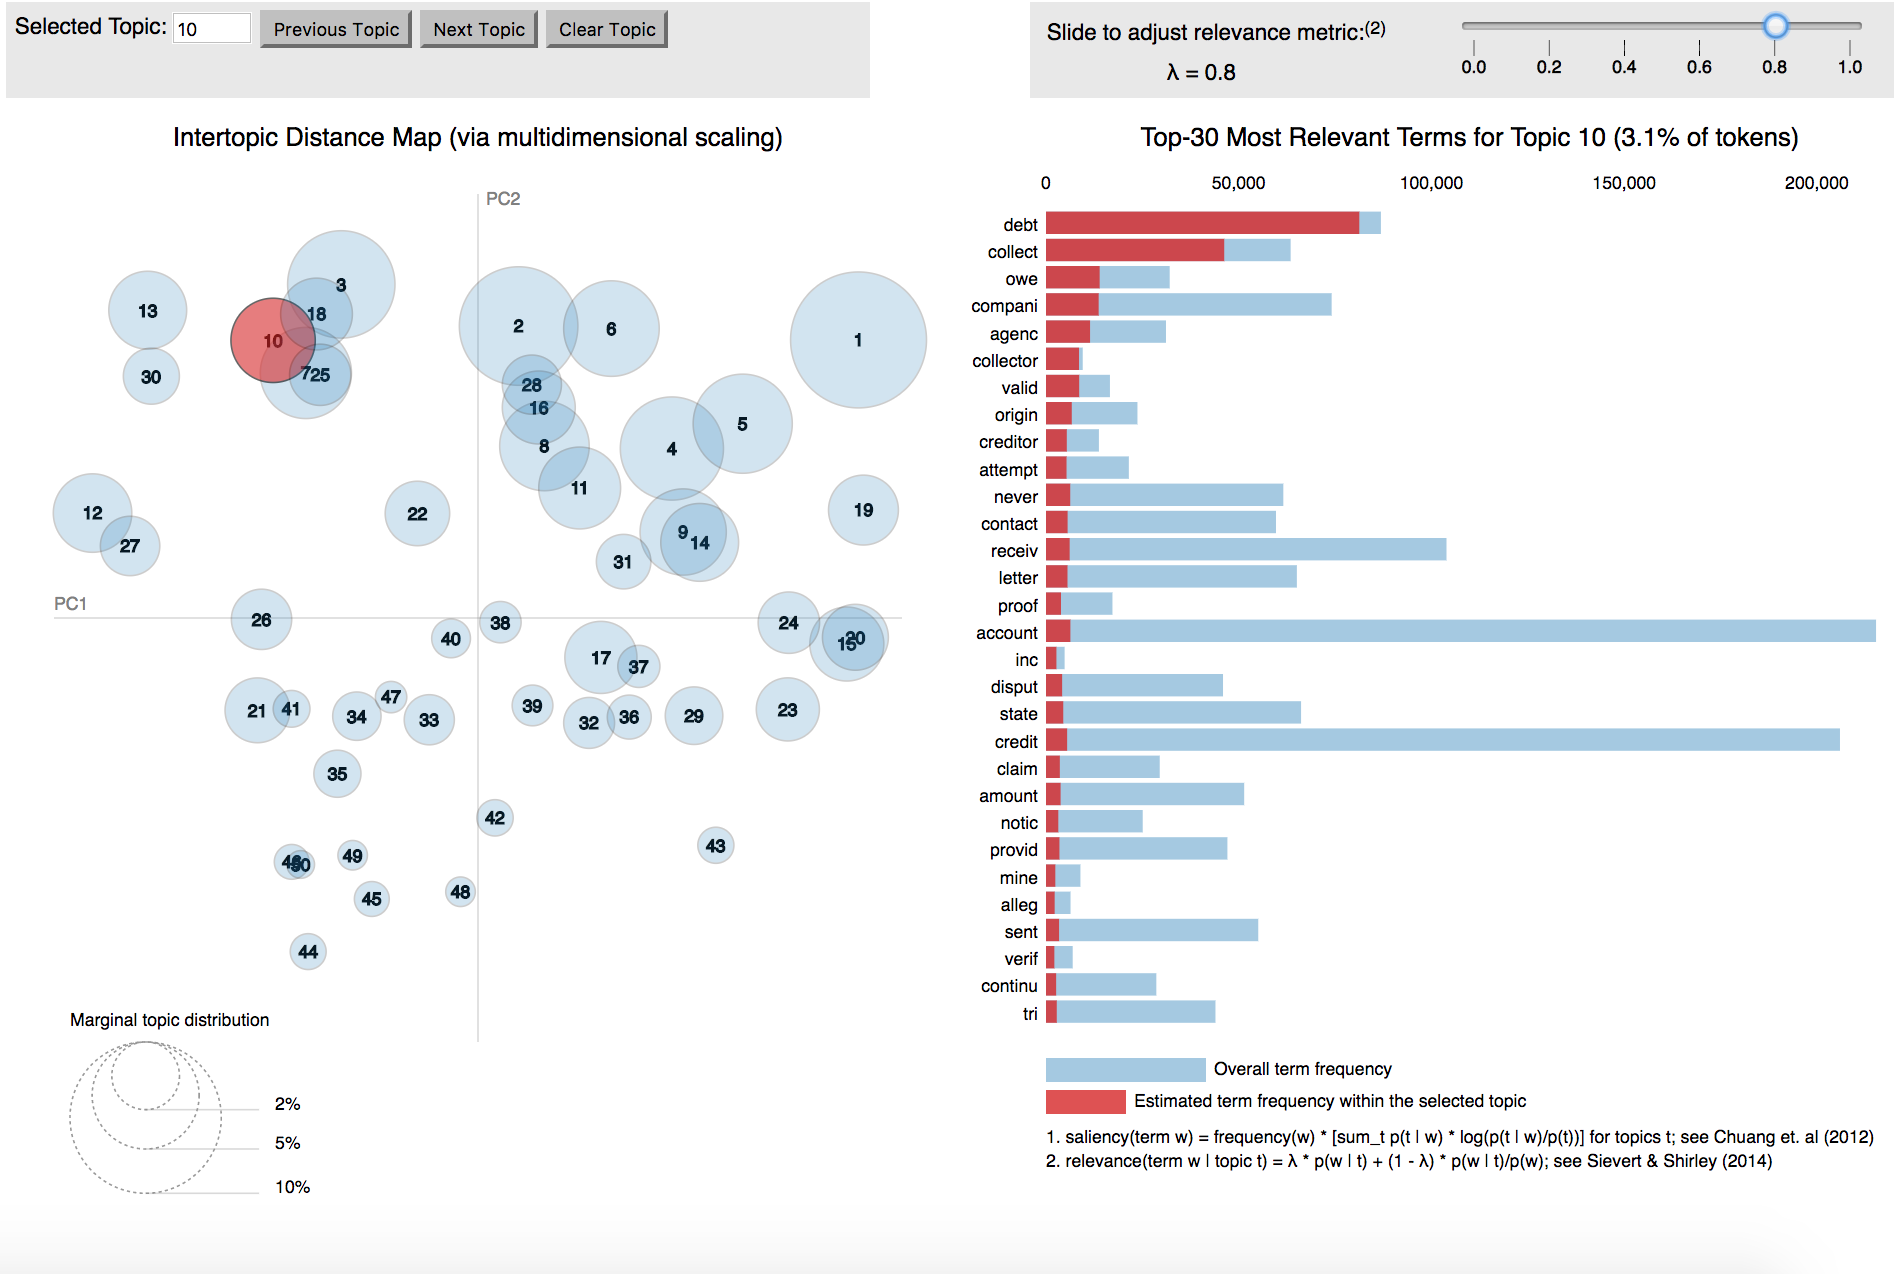
The topic highlighted here (just called #10), groups together words about debt collectors. The right-hand side walks includes the words that are common in each topic (the red bars) and the words frequencies across the entire dataset (blue bars).
This type of clustering is especially convenient for large datasets, where it’s impractical to read every one of the entries. Instead, you can look at the topics, and then check the distribution of those topics, especially where they are limited to certain groupings.